Prior Research:
Scholars have found evidence that hurricanes and storms both do and do not affect migration, which tends to vary based on the places studied and their levels of economic development. These contradictory findings would seem to call for a deeper investigation of the causal mechanisms underlying climate migration, but our understanding is also limited here. Do individuals and families migrate as a consequence of long-term factors (e.g., frequent, medium-intensity flooding) or short-term ones (e.g., a single severe flood)? Do they migrate on the basis of rational, cost-minimizing calculations, or are they influenced by cognitive biases that lead them to overestimate the true costs of one disaster? And what role do certain amenities (e.g., reliable infrastructure) or forms of protective insurance play in decreasing the incentives to migrate?
It is difficult to sustain a purely instrumental account of migration, which is largely driven by existing social networks and occurs over short distances. For example, many survivors of Hurricane Katrina moved to Houston, which is a similarly exposed city just over 300 miles away. Even long-distance migration tends to be driven by social networks and may offer little protection against storms. Finally, migration is costly, not only in terms of moving but because housing prices in less-exposed areas are often bid up for that very reason.
Data, Methods, and Results:
Behrer and Bolotnyy’s empirical analysis is guided by several questions. First, do we observe greater outmigration after storms? Second, do migrants move to less at-risk counties? And finally, has the overall population of high-risk areas declined over the last 25 years? To answer these questions, the authors utilize migration data from the Internal Revenue Service (IRS) as well as storm exposure data from the National Oceanic and Atmospheric Administration (NOAA), the National Hurricane Center, and the Federal Emergency Management Agency (FEMA). Their regression models estimate the extent of migratory change in storm years relative to non-storm years, including lagged models that estimate changes in the years following storms.
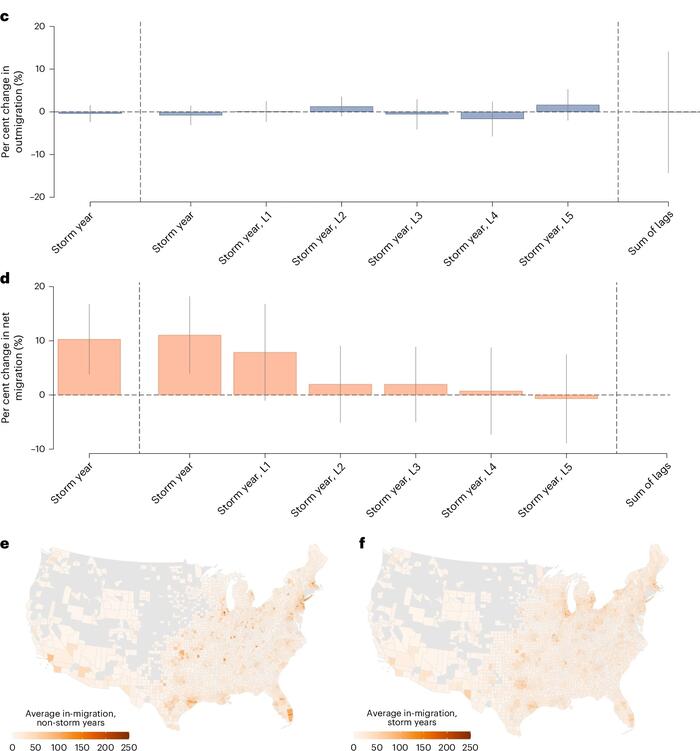
Fig. 1C-F: c,d, Coefficients from a panel fixed-effects regression of outmigration (c) and net migration (d) on whether a county experienced a storm. The first bar plots the coefficient from a regression with only contemporaneous storms. The next six bars show coefficients from a separate regression that includes contemporaneous storms and five year lags (L1–L5). The final bar shows the sum of the coefficients from the lags regression. The light grey lines show the 95% CIs. The sample size for these regressions was 52,514 for the outmigration results and 52,448 for the net migration results. e, Migrant-receiving counties in our sample period and the average number of migrants received in non-storm years. f, The same as e but in storm years.
Their results indicate that American outmigration has not increased at statistically significant levels after storms. In addition, there is no evidence that migrants in storm years move to less exposed areas compared to migrants in non-storm years. The most damaging storms are indeed followed by increased outmigration, but there is no evidence that migrants move to low-risk areas. In fact, they often migrate to other high-risk areas and to places with high economic activity. This is because the majority of American GDP is generated in coastal areas where storms are more prevalent. The authors thus uncover a tradeoff, namely that places in the U.S. with more opportunity face more risk. GDP is substantially more predictive of migration than storm risk. The economic and social benefits of moving to high-risk areas appear to outweigh any incentives to reduce one’s storm exposure via relocation. Finally, the authors find that overall population exposure to storms has increased.
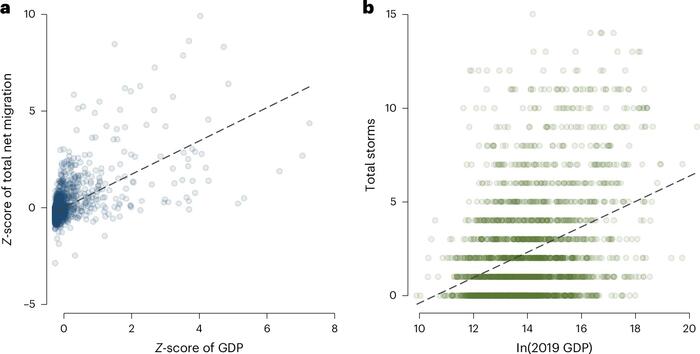
Fig. 4: GDP versus net migration and number of storms. a, Correlation between net migration and GDP. The Z-score of total net migration is the Z-score across all counties of the sum of net migration (in-migration minus outmigration) for each county across all years in the sample. The Z-score of GDP is based on county GDP in 2019, as measured by the Bureau of Economic Analysis. All points are shaded equally, with darker areas on the graph indicating a greater density of counties. We omitted three outliers with GDP Z-scores >10. We show a version of this figure that includes the outliers in Supplementary Fig. 3. b, Correlation between the number of storms and GDP. Total storms is the sum of storms hitting each county across all years in our sample. ln(2019 GDP) is the natural log of county GDP in 2019, as measured by the Bureau of Economic Analysis. All points are shaded equally, with darker areas on the graph indicating a greater density of counties. The x-axis units are log points.
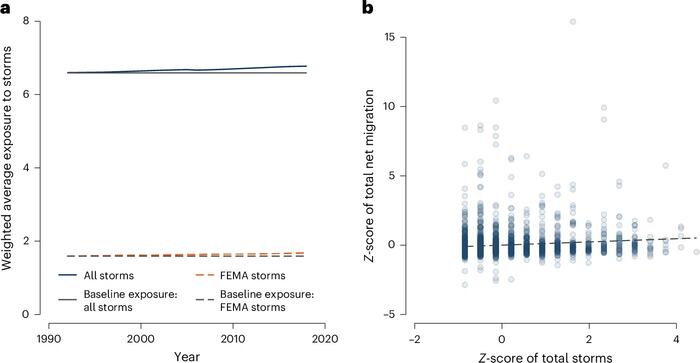
Fig. 3: Trend in population-weighted exposure and correlation between net migration and total storms. a, Trend in population-weighted exposure. We plotted the weighted average number of storms across all 2,387 counties in our sample. Weights are the county population in each year. The number of storms in each county is the sum over the sample and so remains constant across years. The change in the trend line is due to changes in where people live. The flat grey lines show the weighted average if populations had not changed from 1990 levels—that is, if no one had moved. The solid lines show all storms. The dashed lines show storms with at least US$10 million in damages according to FEMA. b, Correlation between net migration and total storms. The Z-score of total net migration is the Z-score across all counties of the sum of net migration (in-migration minus outmigration) in the county across all years in the sample. The Z-score of total storms is the Z-score across all counties of all storms over our sample period. All points are shaded equally; darker areas on the graph indicate a greater density of counties. The dashed line is the linear best fit line of the plotted data points.
The authors caution that these findings may be driven by (a) those Americans most impacted by storms being least able to move, this despite their preferences to do so, and (b) those with the means to insure themselves against climate risks having weaker preferences to move. In addition, migration within the same county — for example, moving from lower to higher sea level areas — may be a significant but hidden process that enables climate adaptation. The findings may also be less relevant to understanding migration dynamics in low- and middle-income countries, especially in places with less comprehensive insurance and less resilient infrastructure.
Behrer and Bolotnyy deepen our understanding of the importance and “stickiness” of geography. Indeed, many people do not or cannot move, even if they want to and even if staying in place puts them at risk. One wonders about how these processes interact with politics. For example, climate change has coincided with the powerful forces of climate change denial. Perhaps skepticism about storms as systemic phenomena is blunting migratory pressures, leading those affected to view them as one-off occurrences. Similarly, social scientists have coined the term “petro-masculinity” to describe an identity that views the climate change consensus as an attack on, e.g., driving large trucks or eating meat. It may be that when this identity is salient, people view climate migration as a form of weakness or betrayal.
*Brief prepared by Adam Fefer.